

Economic Decisions & Market Recap
for the week of July 29th 2024
The content of this Newsletter is to provide you with Economic insights to assist you in making better decisions with your investments. Unlike many other financial periodicals we will not mention specific companies, unless it is relevant to an overall economic issue. We welcome your questions on economic concerns and will address in our newsletter. just email us at info@optfinancialstrategies.com #FinancialAdvisor,#investmentmanagement #wealthmanagement #financialplanning #retirementplanning #401kplans
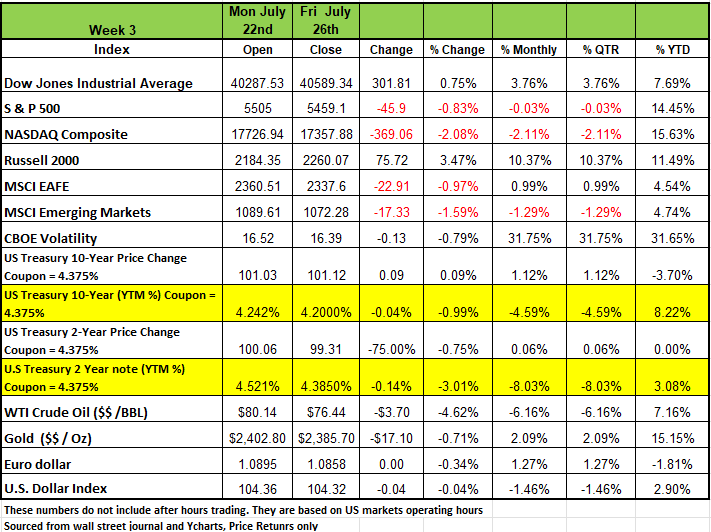
A volatile week in the makets. Two of the four major indices returned positive number last week with the Russell posting the largest weekly increase of +3.47% followed by the DOW, which suffered a large decline of -1.2% on Wednesday and bouncing back on Friday to end the week at +0.75%. The S&P 500 and NASDAQ both fell for a second consecutive week after sharp selloffs in Tesla (TSLA) and Alphabet (GOOG, GOOGL). The benchmark equity index ended Friday's session down -0.83% after rebounding from a -2.1% decline on Wednesday as well and the NASDAQ, which ended the week -2.08% after skidding -3.6% on Wednesday.
Investors are looking ahead to further mega-cap earnings and the Federal Reserve's monetary policy meeting scheduled for Tuesday and Wednesday of this week.
This week, investors will focus on several major companies scheduled to report earnings such as Apple (AAPL), Microsoft (MSFT), Meta Platforms (META), and Amazon.com (AMZN). Other big names include Intel (INTC), Boeing (BA), Pfizer (PFE), McDonald's (MCD), AMD (AMD) and Exxon Mobil (XOM).
The tech sector was dragged lower mainly by a -16% plunge in CrowdStrike (CRWD) shares as markets continue to assess the potential impact of Friday July 19th global technology outage that stemmed from a company software update that had a coding error. We expect the company will have significant law suites based on the lost revenue from customers like the airlines.
In economic news, the pace of US consumer spending growth eased in June, while the Fed's preferred inflation metric held steady annually. The economy grew at a stronger-than-projected pace in Q2 as consumer spending accelerated while inflation cooled, according to an advance estimate released last week by the Bureau of Economic Analysis.
Markets are widely expecting the central bank's monetary policy committee to hold interest rates steady this week and deliver a 25-basis-point cut in September, according to the CME FedWatch tool. Fed Chair Jerome Powell is expected to signal that the Federal Open Market Committee is close to easing monetary policy on Wednesday.
Treasury yields were down across the board this week, as inflation data signaled that rate cuts are very likely in September. Existing home sales declined to a 3.89m annualized rate in June, falling below the consensus expected 3.98m. Sales decreased across all the major categories and are down 5.4% compared to a year ago. June new home sales also came in weaker than expected, declining by 0.6% to a 617k annual rate, this is below the expected 640k.
The anticipation of rate cuts and 30-year fixed mortgage rates remaining above 7% are likely the reasons buyers have been hesitant. Real GDP increased at a 2.8% annual rate in Q2 on Thursday, surpassing the consensus expected 2.0% but falling well short of the average growth of 4.2% in 2023. New orders for durable goods declined by 6.6% in June, falling significantly below the consensus expected 0.3%. The decline was primarily due to a sharp fall in transportation orders and marked the largest monthly drop since March and April 2020.
On Friday, June PCE prices rose 0.1% and are up 2.5% over the past year compared to a 3.2% gain in the year ending in June 2023. Core prices rose 0.2% and are up 2.6% compared to a year ago, a large improvement from the 4.3% reading for the twelve months ending June 2023. Inflation remains above the Fed’s 2.0% target, but the numbers have moved in a positive direction since the Fed's last meeting.
Sectors
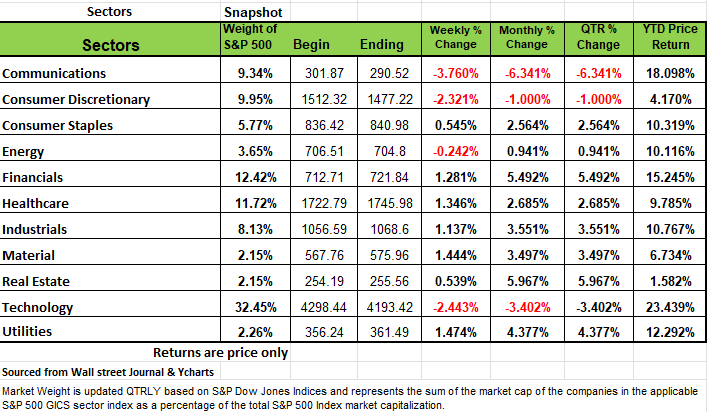
Communication services and technology saw the steepest declines for the week among sectors, down -3.8% and -2.4%, respectively, while consumer discretionary fell -2.3%. Energy also saw a decline, while the remaining sectors posted gains, led by utilities' +1.5% increase.
The Communication sector was dragged lower by a 6% drop in Alphabet. The Google parent's Q2 results topped Wall Street's expectations, though its management flagged caution about decelerating advertisement trends. Charter Communications (CHTR) jumped 15% after reporting better-than-expected results.
Tesla's -8.1% decline following a Q2 earnings miss weighed on the consumer discretionary sector's performance for the week. Ford Motor (F) plunged -20% after posting lower-than-projected Q2 earnings, while Mohawk Industries (MHK) surged 25% after its results topped Street views.
The health care sector rose 1.4% with Molina Healthcare (MOH) jumping 16% following a Q2 beat, while Edwards Lifesciences (EW) slid 28% on a sales miss.
Consumer staples saw a 0.6% gain. Frozen fries maker Lamb Weston (LW) guided for an annual decline in fiscal 2025 earnings, sending its shares down -27% for the week.
Industrials gained 1.1% amid a 22% jump in 3M (MMM) following a Q2 beat, while United Parcel Service (UPS) slipped 11% after its Q2 results fell short of market expectations, and the company tempered its full-year revenue outlook.
Results of Bad Decisions
The Congressional Budget Office (CBO) revised its Budget and Economic Outlook for the next 10 years. (2024-2034), the update revealed some startling projections. The deficit estimates for 2024 have increased by $400 billion, a 27% rise from its estimate 5 months ago. The new deficit projection for 2024 is expected to be $2.0 trillion, which is 7% of our GDP. The projection for 2025 is expected to be 6.5% of GDP in 2025, and then fall to 5.5% by 2027, only to rise again to 6.9% by 2034.
Keep in mind that this is the annual deficit only not the overall debt that the country is accumulating which is currently at a staggering 127% of GDP
Why are these numbers so alarming, especially considering that the budget deficit averaged 2.8% of GDP from 1970 through 2019, because the deficit is expected to double that half-century average over the next 10 years. What is also disturbing is that these numbers may still be overly optimistic. It could be a lot worse depending on a few factors, one of which is the interest rate on the debt and the 2nd is the reckless spending by the government. The CBO has not forecast any recessions for the next decade, which seems to be improbable, because the U.S. has never gone 14 years without entering a recession. What happens during a recession is that it typically causes budget deficits to widen as tax revenues fall and expenditures rise. The CBO estimates that inflation should moderate to 2.2% over the next decade, and they predict long-term interest rates will peak at 4.5%, staying at or below 4% for the next decade. Given the current amount of government spending, these estimates for inflation and interest rates seem overly optimistic.
Last month, the International Monetary Fund warned the U.S. and other developed nations about runaway fiscal spending. In the IMF’s April Fiscal Monitor, they estimate that the U.S. deficit will be 7.1% of GDP in 2025, over three times the 2% average for other advanced economies. The agency cautioned that large deficits in the U.S. and China pose significant risks to the global economic environment and need to be addressed. The IMF's criticism of U.S. spending since the COVID pandemic is well-founded, as the U.S. is running its economy more like an emerging market than an advanced economy. The U.S. deficit resembles that of a developing nation, while advanced peers are running much smaller deficits or even surpluses, as in the cases of Ireland and Denmark.
We are bringing this to your attention again because this information should concern every American. Runaway fiscal spending is highly inflationary, and the surge in government debt issuance will continue to press interest rates higher. Historically, during recessions, large deficits result from increased government spending as tax receipts fall and unemployment soars. Recessions are inherently disinflationary, which helps to offset the inflationary aspect of increased government spending. Thus, when we are not in a recession and yet government spending is out of control, we should not be surprised when inflation takes off. The hard part for many investors to filtering out the noise created by the media. Most of the pundits on the financial networks are paying to be on the show and their objective is to paint as Rosey a picture in order to attract new assets. That is the game collect assets.
The recession caused by COVID was deep but also one of the shortest in history, lasting from February to April 2020. This brief but severe economic contraction was marked by a significant decline in GDP and employment, with GDP falling by 5% in the first quarter and 31.4% in the second quarter of 2020. The rapid implementation of fiscal and monetary policies, including stimulus packages and interest rate cuts, contributed to a swift recovery following the recession's trough in April 2020, but that came at a cost.
Had the government paid more attention to the behavior of consumers we would have prevent a lot of the headaches we are experiencing. Allowing consumers to avoid paying rent without consequences is just one example of bad behavior that resulted in high inflation.
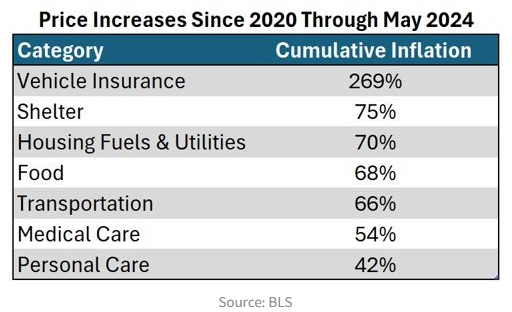
Since 2020, inflation has dramatically increased with prices continuing to head higher, heavily impacting most American households. Below are various categories within the Consumer Price Index and their cumulative inflation increase over the last five years. Most consumers have not seen their incomes grow by 40% to 100%, which is why many feel their standard of living is slipping away.
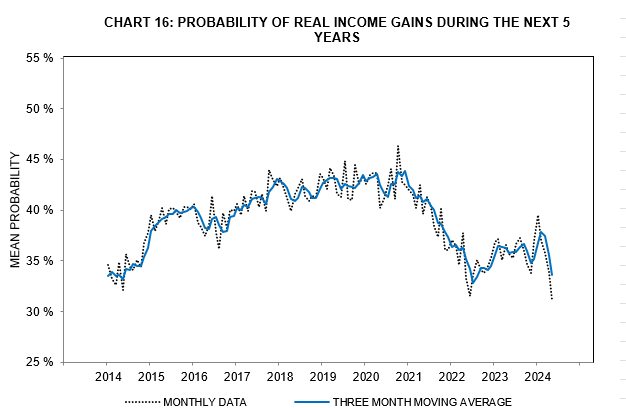
Every month, the University of Michigan releases its Consumer Sentiment report, https://data.sca.isr.umich.edu/charts.php which includes questions about consumer spending habits, job prospects, buying intentions, and income growth expectations. The June report revealed some troubling insights into the consumer outlook. The expectation that incomes will grow above the rate of inflation over the next five years has fallen to the lowest level on record at 25.3%. This means 75% of the country believes their standard of living will decline over the next five years, after already experiencing a decline over the last four years.
There has been a dramatic decline in consumer sentiment surveys over the last several months. We believe this decline is due to several factors: 1) the exhaustion of excess savings from pandemic stimulus checks provided by the government. Initially, these stimulus checks shielded consumers from the impact of dramatic price increases, as they were paid more for staying out of work than they did while working spending the taxpayer’s money rather than their own savings. 2) Many Americans were “double dipping” and collected stimulus money while working from home as a gig employee so many were flush with cash. 3) Consumers did not adjust their behavior when the money stopped flowing and now with credit card debt above pre pandemic levels leaving less to spend with higher credit card balance from higher interest on credit cards. The Federal Reserve Bank of San Francisco estimates the excess savings was exhausted as of March, and now that these funds have been depleted, consumers are feeling the full brunt of these price increases.
It is not only the consumer that is being squeezed by elevated prices, but businesses are also feeling it as well. When businesses begin to see their sales moderate, they attempt to protect their margins by reducing the biggest line item in their budget: payroll. The typical payroll/business cycle begins with employers cutting temporary workers, the easiest to let go and the least trained, followed by reducing hours, forcing full-time workers into part-time status. The last measure, should sales/demand not rebound, is to start reducing payrolls through layoffs.
During the pandemic we had a significant labor shortage Many Americans over age of 55 either left he work force or reduced their workload. Many hourly lower income workers just lived off the money provided by the government. Businesses owners were desperate for workers and over-hired and had more part time workers since many did not care enough to work with a safety net from the government.
The shortage of the labor force has distorted the labor market over the last few years and for those Americans with higher retirement accounts due to the inflow of 5 trillion dollars into the economy many do not feel the need to work.
However temporary payrolls have fallen by 515,000 workers. We have also clearly seen the turning point in full-time versus part-time workers, which started in June of 2023. Since then, full-time workers’ payrolls have gone down by 1.5 million jobs while part-time workers have risen by 1.7 million. Just one Red Flag of a coming recession is a decline in temporary payrolls and growth of part-time workers outpacing full-time workers, and we clearly have both. Soon we think we will see an outright decline in payroll numbers.
So, the main question investors need to ask themselves is whether or not they are happy with the current gains they have achieved in the last two years or if they want to push for more return and risk losing some or all of those gains because of a recession. Here is where the balancing act comes into play and for each investor to evaluate their own specific position.
A Technical Perspective
For most of our market commentaries this year, we have been talking a lot about the technology-related sector leadership and the significant impact it has on the markets. During May and June, markets were almost exclusively being led higher by technology, In mid-June, we saw Market Breadth Weaken as Technology continued to rise
In recent weeks, we have seen a reversal. Since the Nasdaq 100’s peak on July 10th, the Nasdaq (an index mostly composed of tech stocks) is down -8%. The technology-skewed S&P 500 is down about -3%, but the average S&P 500 stock (or equal weight index) is up almost +3%. While the market index has been falling the last few weeks, most stocks are rising. This is due to the distortion of a cap weighted index
Are we seeing a shift away from technology-related stocks? In the short term, many technology stocks have pulled back and have lost momentum. The hottest stock talked about this year has been Nvidia. Nvidia is down -16% in just the last eight trading days. Meta and Google are each down about -12.5% over that same timeframe. In addition, Tesla rose +33% from July 1st to July 10th, but has fallen nearly -17% since then. Tesla is a stock that has no idea where it wants to trade.
The Average Stock is Rising
While technology stocks are losing momentum, most stocks are gaining it. According to our risk-adjusted sector rankings, Financials is the number one ranked S&P 500 sector. The rise of Financials has boosted small cap stocks. Unlike the S&P 500, which has more than 40% of its exposure to technology-related securities, the Russell 2000 index has its largest exposure in Financials. It’s second largest is Industrials. These two areas have been strong in recent weeks.
Volatility-Weighted-Relative-Strength rankings, Financials is ranked 1st, Utilities is 2nd, and Real Estate and Healthcare round out the top 4. These sectors have all been near the bottom of the sector rankings at some point this year. The technology-related sectors, which are Information Technology, Communications, and Consumer Discretionary, are now near the bottom of the rankings.
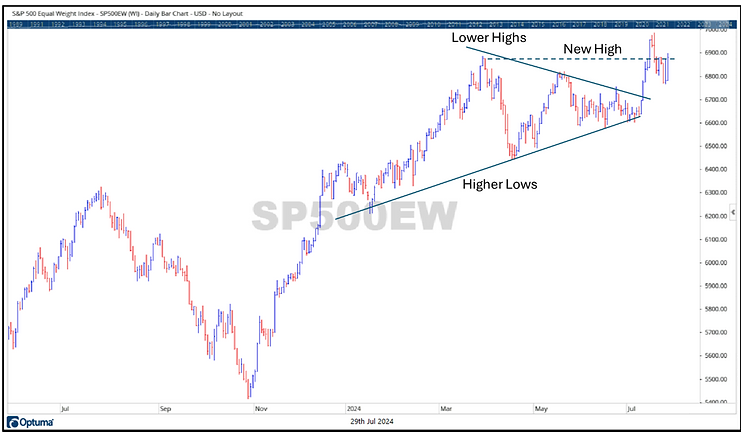
Look at the chart below. It shows the equal-weight S&P 500 index, which paints an image of what the average S&P 500 stock is doing. You can see that for most of this year, the index has been putting in a series of lower highs and higher lows. This means that the battle between supply and demand is getting tighter and tighter, forming a “triangular” pattern and waiting for one side to win out. Recently, the index broke out and set a new high-water mark.
Over the last few weeks, there has been a definite shift away from technology stocks and into other areas of the market. While the average stock has risen in the last few weeks, several large technology stocks have dragged and pulled capitalization weighted indexes down. Contributed by Brandon Bischoff
The Week Ahead
Another busy week is on deck with central bank decisions, U.S. labor and wages data, and key corporate earnings announcements. On Wednesday, the Federal Reserve is expected to hold interest steady ahead of an expected cut at the September meeting. The Fed may signal the cut at this meeting, or they could choose to wait until the Jackson Hole Symposium in late August. The monthly U.S. labor market numbers are on tap, starting with the JOLTS job openings on Tuesday, ADP private payrolls on Wednesday, and finally the government non-farm payrolls on Friday. Wage growth will also be top-of-mind with inflation trending lower recently. Preliminary estimates for the second-quarter employment cost index and unit labor costs arrive this week. On the earnings front, most of the technology giants that haven’t already reported are scheduled to this week, including Apple, Amazon, Microsoft, Advanced Micro Devices, and Meta Platforms. Consumer confidence, pending homes sales, ISM manufacturing PMI, and factory orders round out the U.S. economic agenda.
Overseas, the Bank of Japan will announce its interest rate decision Tuesday evening, and the Bank of England will follow on Thursday morning. The Japanese yen has strengthened recently versus the U.S. dollar, leading some to speculate that the BOJ will hike rates by 10bps and announce a plan to reduce ETF purchases. The latest economic data out of the UK suggest that odds of a rate cut at this week’s meeting are 50/50. Europe will be focused on the latest inflation numbers that come out mid- week. Last of all, China’s manufacturing and services PMI arrive Tuesday evening, along with Australia’s CPI and retail sales reports.
.
This article is provided by Gene Witt of FourStar Wealth Advisors, LLC (“FourStar” or the “Firm”) for general informational purposes only. This information is not considered to be an offer to buy or sell any securities or investments. Investing involves the risk of loss and investors should be prepared to bear potential losses. Investments should only be made after thorough review with your investment advisor, considering all factors including personal goals, needs and risk tolerance. FourStar is a SEC registered investment adviser that maintains a principal place of business in the State of Illinois. The Firm may only transact business in those states in which it is notice filed or qualifies for a corresponding exemption from such requirements. For information about FourStar’s registration status and business operations, please consult the Firm’s Form ADV disclosure documents, the most recent versions of which are available on the SEC’s Investment Adviser Public Disclosure website at www.adviserinfo.sec.gov/
