

How Far are Markets Stretched?
&
Market Review
The content of this Newsletter is to provide you with Economic insights to assist you in making better decisions with your investments. Unlike many other financial periodicals we will not mention specific companies, unless it is relevant to an overall economic issue. We welcome your questions on economic concerns and will address in our newsletter. just email us at info@optfinancialstrategies.com #FinancialAdvisor,#investmentmanagement #wealthmanagement #financialplanning #retirementplanning #401kplans
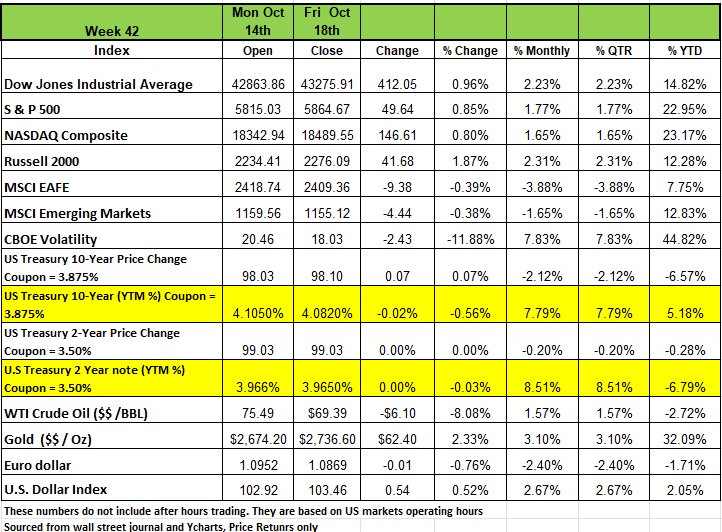
All four of the major indices rose last week just ever so slightly. The Russell 2000 led the pack with a +1.87% increase followed by the DOW +0.96%, the S&P 500 + 0.85% and the NASDAQ .80%, It is the sixth consecutive weekly gain, as a number of heavyweight US companies released quarterly results that topped expectations for Q3.
Companies including Netflix (NFLX), Goldman Sachs Group (GS), Morgan Stanley (MS) and Bank of America (BAC) released quarterly results above analysts' expectations this week, giving a boost to US stocks and investor sentiment.
Treasury yields were flat for short-term maturities last week while they dropped slightly for long-term maturities as the market digested earnings from a number of companies, that along with economic reports and their impact on the probability of a soft landing for the economy. The week began with softness in the semiconductor segment, leading investors to speculate that the Federal Reserve Bank may quicken the pace of interest rate cuts and longer-term Treasurys to drop more materially than short-term Treasurys. This view was backed up by a weak October Empire Manufacturing reading of -11.9, compared to 11.5 last month and consensus expectations of 3.6. However, yields rose during the second half of the week as September Retail Sales rose 0.4%, compared to 0.1% last month and consensus expectations of 0.3%.
Initial Jobless Claims were also lower than expected with a sequential drop from last month. Together, these led investors to believe that the economy may be running too fast to cut rates as quickly as expected. The market implied probability of an increase in the Federal Funds Rate at the November 7th meeting rose from 89% to 95% over the course of the week and the implied rate remained relatively the same for the end of 2024 and throughout 2025. Oil prices dropped 8% as Israel assured that it would not target Iran’s oil facilities.
Sectors
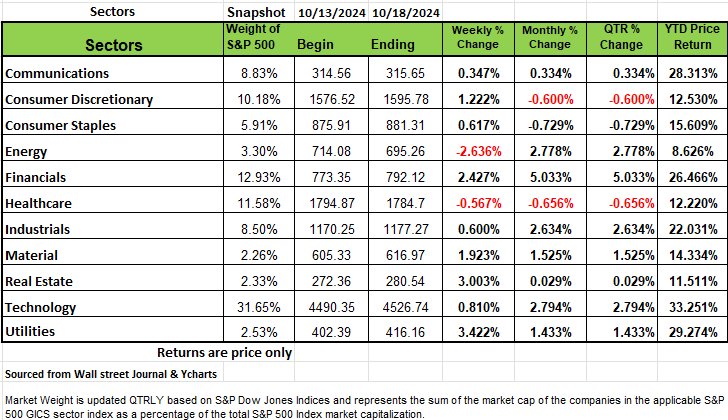
All but two sectors rose, led by a 3.4% climb in utilities and a 3% increase in real estate. Financials, materials and consumer discretionary were also up by more than 1% each. The utilities sector's gainers included shares of WEC Energy Group (WEC), which rose 4.6% on the week amid price target increases from analysts at firms including Mizuho Securities and Wells Fargo.
In real estate, shares of BXP (BXP) rose 8.1% as Jefferies raised its price target on the stock to $91 per share from $78. Jefferies also maintained a buy investment rating on the shares of BXP, which plans to release Q3 results on Oct. 29.
Energy and healthcare were the sectors in the red for the week, falling 2.6% and 0.6%, respectively.
The energy sector's loss came as crude oil futures also fell this week. Halliburton (HAL) shares had the largest percentage drop in the sector this week, sliding 8.1% amid price target reductions from analysts at Barclays and Benchmark.
Next week, companies releasing quarterly results will include GE Aerospace (GE), Danaher (DHR), Philip Morris International (PM), Verizon Communications (VZ), Tesla (TSLA), Coca-Cola (KO), International Business Machines (IBM), Amazon.com (AMZN), Union Pacific (UNP), United Parcel Service (UPS) and Colgate-Palmolive (CL).
The invincible Market
How much further can markets go before a significant correction occurs? It seems like every week we hear that a specific index has reached an all-time high. There is enough noise in the media to cause less seasoned investors to increase their risk tolerance in fear of missing out (FOMO). This is especially the problem when some so-called expert voices their opinion that the markets have further to go. For example, a recent article in Forbes magazine had the following headline “Nvidia Can Approach $5 Trillion Valuation With ‘Generational’ AI Opportunity Still Ahead, B of A Says”. The stock current selling at $135/share putting its market cap at $3.38 trillion would need to go to $202/share to hit $5 trillion
These sensational headlines do in fact impact the unseasoned investors decision making abilities and it is usually here when people get into trouble. High levels of investor optimism and stretched valuations leave investors vulnerable.
One of the most significant aspects of this investment year is the perception of the invincibility of U.S. equities that has emerged within large parts of the investment community. Part of this comes from a belief that big U.S. tech companies in particular are deemed attractive within the fragmented global economy. However, there is still one other aspect of our current environment that Wall Street is overlooking and that is the $5 trillion that was deployed over a short period of time during the pandemic which is still in our system. It does not just dissipate in a year; it takes a long time to work through the economic system.
The idea that the markets are invincible is not an unfamiliar concept, the same thing happened in 2000 during the dot.com bubble and 2008 with the housing bubble. The fear of missing out and believing that the markets are invincible and will keep rising often happens as markets are establishing a major summit. Then some fundamental market stress occurs, and fear takes control. The market then tends to unravel too quickly for most investors that are not paying attention to react. Since many get in close to the peak, they tend to sit on the position longer than they should because no one wants to take a loss but by holding for too long when the market corrects itself, their portfolio value declines more and liquidity needs mean take a large loss
Investor optimism can become a chronic condition. Equity summits are typically extended and marked by rotation as narratives across different styles and industry segments are pushed to extremes.
It’s at this point the invincibility syndrome takes hold, we can see some evidence of this now in various metrics.
For example, the standard Shiller cyclically adjusted price to earnings ratio (CAPE aka PE 10) for U.S. equities has risen to over 35, which is the third highest on record and only surpassed when bond yields were unsustainably low.
The average P/E multiple of the S&P 500 is currently around 29.8, the average P/E over the last 25 years is 25.8. While P/E ratios have seen a higher level of 131.3 it was during the financial crisis of 2008 when many companies had negative earnings. Another metric to consider is the price-to-sales the current measures are back at levels not seen since the market exuberance in 2021. Furthermore, the three-month moving average of the Conference Board’s monthly survey of the American consumers’ view of where stocks will be over the next year has also reached a record high. Keep in mind that these surveys never address increased risk, they are purely emotionally driven.
It may also be worth noting that the consensus among investors that only a recession can kill the bull market is inaccurate. The bear market of 2000–2003 is evidence that a recession can be a consequence rather than a cause of asset price deflation. The market’s assumption is that earnings growth for the S&P 500 through 2025 will be 10% to 15%, based on an expectation of sustained economic growth. What does not make any sense is that the markets are pricing this growth and still more Fed rate cuts. If the economy grows enough to warrant those earnings, then there would be no need for the Fed funds rate to drop below 3% or the 10-year Treasury yield to be sub 3.5%.
Many believe that the S&P will push the boundaries of the 6000-mark making the 4th year in the last 6 years to post +20% return. It is possible that we may be wrong and have been wrong in the past, we prefer to err on the side of caution. Just remember that when financial markets change their mind, they can do so in a very profound way.
On a final note, we are reminded of well know trader Bob Farrells rules for investing
- Markets return to their mean over time
- Excess on one direction leads to excess in the opposite direction
- Excesses are never permanent
- Markets corrections don’t go sideways
- The public buys the most at the top and the least at the bottom
- Be mindful of experts and forecast
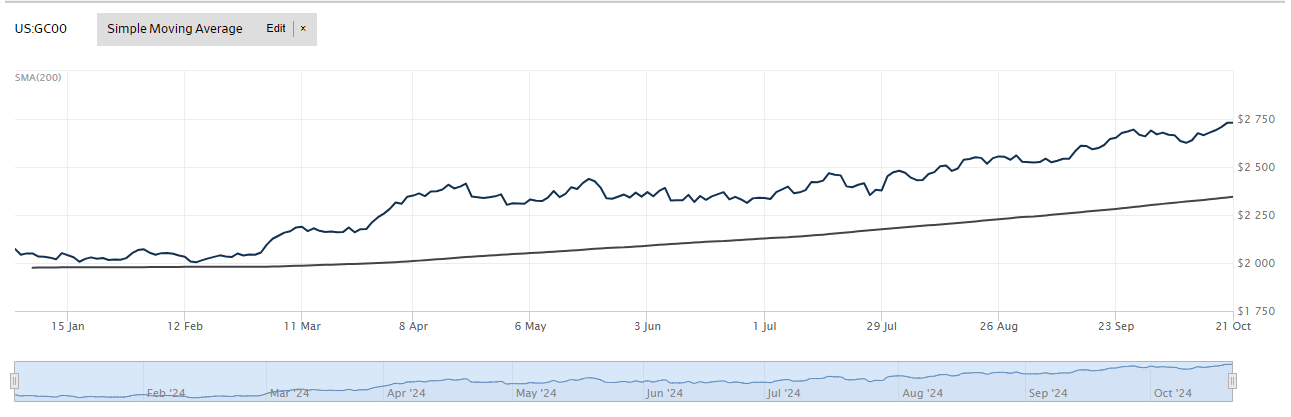
When the price of gold rises significantly, it often reflects underlying concerns about economic stability, geopolitical tensions, and financial market uncertainty. Here are the key factors driving gold's recent price surge:
Economic Uncertainty: Gold's recent price increase is largely driven by lingering economic uncertainties:
Inflation Concerns: Despite efforts to curb inflation, it remains above the Federal Reserve's 2% target. Gold is seen as a hedge against inflation, as it tends to maintain its value when the purchasing power of currencies declines
Interest Rate Expectations: Investors anticipate potential interest rate cuts by the Federal Reserve. Lower interest rates typically make non-yielding assets like gold more attractive compared to interest-bearing investments
Geopolitical Tensions Gold prices often rise during times of geopolitical instability:
Global Conflicts: Ongoing geopolitical tensions and conflicts contribute to gold's appeal as a safe-haven asset
US Presidential Election: The upcoming US election is creating uncertainty, with polls showing a tight race. This political uncertainty is fueling demand for gold as a hedge against potential market volatility
Central Bank Buying
A significant factor in gold's price surge is increased demand from central banks
Diversification of Reserves: Many central banks, led by China, are buying gold to diversify their reserves and reduce reliance on the US dollar
De-dollarization Concerns: Some analysts see central bank gold purchases as a sign of waning reliance on the dollar, potentially due to concerns about sanctions or geopolitical shifts
Market Volatility and Safe Haven Appeal
Gold's traditional role as a safe-haven asset is reinforced during times of market uncertainty:
Portfolio Hedging: Investors are using gold as an effective portfolio hedge against potential market volatility, especially in light of economic and political uncertainties
Alternative to Other Assets: In some regions, like China, investors are turning to gold as an alternative to underperforming property and equity markets
The underlying concern when gold prices rise is often a combination of these factors, reflecting broader anxieties about economic stability, geopolitical risks, and the performance of traditional financial markets. Gold's price increase signals that investors are seeking safety and stability in an uncertain global environment.
The Week Ahead
U.S. corporate earnings reports will remain in focus, while global flash PMI surveys will provide a glimpse into manufacturing and services sector trends early in Q4. Geopolitical tensions remain high, investors await any Israeli reaction to Iran’s missile attacks.
On the economic calendar, the Bank of Canada makes its interest rate decision on Wednesday, and there is speculation for a 50- basis point cut after the latest CPI data.
There are two meetings of global finance leaders this week, the first being the annual International Monetary Fund and World Bank gathering in Washington D.C., where the upcoming U.S. Presidential election will be a top discussion point. The second is the BRICS summit in Russia—the host nation will look to convince other emerging economies to build an alternative international payments system to counter the U.S. dollar’s dominance in global trade. In the U.S., the economic agenda is light, with housing data and durable goods orders the most notable reports. Investors will be mindful of earnings results from the likes of Tesla, UPS, Boeing, Texas Instruments, IBM, and others. Overseas, China will stay in the spotlight for any potential new announcements on stimulus policies. The People’s Bank of China is expected to lower its loan prime rates by 20 basis points to match cuts made to the 7-day reverse repo rate made last month. Finally, Japan’s Tokyo CPI will be released on Thursday evening and will be important for gauging the Bank of Japan’s rate hike timing
This article is provided by Gene Witt of FourStar Wealth Advisors, LLC (“FourStar” or the “Firm”) for general informational purposes only. This information is not considered to be an offer to buy or sell any securities or investments. Investing involves the risk of loss and investors should be prepared to bear potential losses. Investments should only be made after thorough review with your investment advisor, considering all factors including personal goals, needs and risk tolerance. FourStar is a SEC registered investment adviser that maintains a principal place of business in the State of Illinois. The Firm may only transact business in those states in which it is notice filed or qualifies for a corresponding exemption from such requirements. For information about FourStar’s registration status and business operations, please consult the Firm’s Form ADV disclosure documents, the most recent versions of which are available on the SEC’s Investment Adviser Public Disclosure website at www.adviserinfo.sec.gov/
