
Half Time
Market Report for 2024
The content of this Newsletter is to provide you with Economic insights to assist you in making better decisions with your investments. Unlike many other financial periodicals we will not mention specific companies, unless it is relevant to an overall economic issue. We welcome your questions on economic concerns and will address in our newsletter. just email us at info@optfinancialstrategies.com #FinancialAdvisor,#investmentmanagement #wealthmanagement #financialplanning #retirementplanning #401kplans
Market Recap
Last week was a shorten week for the markets only trading for 3 and half days. The previous week ending June 28th marked the end of the week, the month, the 2nd Qtr of 2024.
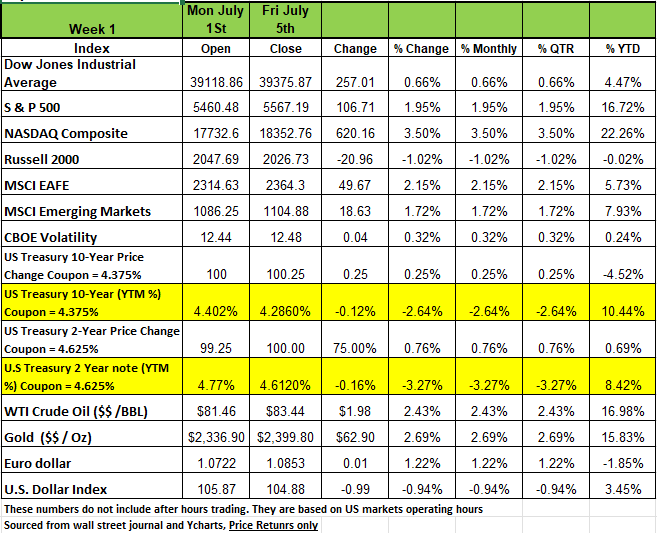
We have made it through the first half of the year and so far, the markets appears to have been doing well, or have they? For the week the markets posted positive returns on the week with the NASDAQ posting the largest increase with a +3.5% return followed by the S&P +1.95% the DOW increased by +0.66% and the Russell was the only decline with a -1.02% drop
The index's first-half gain of +14.48% was just shy of last year’s first-half increase of nearly 16%.
Revised gross domestic product data showed the US economy grew at a slightly faster rate in the first quarter than previously forecast, while inflationary pressures intensified. US consumer spending rose less than expected in May while inflation slowed down at the monthly and annual levels. This week we will get CPI data for the month of June and, depending on the number, markets will react accordingly.
On the treasury side following a spike on Monday, Treasury yields fell in every other trading session to finish the holiday-shortened week lower (only the 3-Month yield ticked higher). Economic releases throughout the week as well as comments from Federal Reserve Chairman Jerome Powell helped raise investor expectations around the likelihood of rate cuts by the end of the year. On Monday, the ISM Manufacturing Index declined to 48.5 in June, lagging the consensus expected 49.1. The index continued to fall deeper into contraction territory and has now contracted for nineteen out of the last twenty months after peaking in March of 2021. Wednesday’s release of the May Trade Balance came in at $75.1 billion, smaller than the consensus expected $76.5 billion. Exports fell by $1.8 billion, led by civilian aircraft and nonmonetary gold while imports declined by $1.2 billion, led by pharmaceuticals and autos. Also on Wednesday, the June ISM Non-Manufacturing Index fell to 48.8, well below the consensus expected 52.7. The major measures of activity were all lower in June, and the abrupt decline is adding to the growing pile of evidence that the U.S. economy is running out of steam. Investors returned from the 4th of July holiday on Friday to the June Employment report which showed an increase of 206,000 nonfarm payrolls, narrowly beating the consensus expected 190,000. The unemployment rate also rose to 4.1% in June from 4.0% in May
Sectors
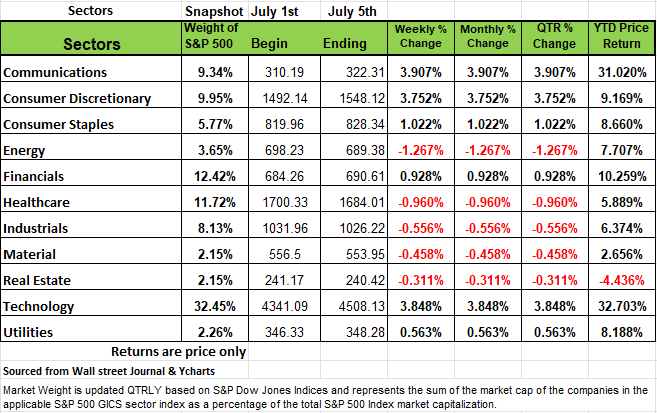
By sectors, communication services and technology led the weekly advance, up about 3.9% each, on a YTD basis both sectors ended the first half of 2024 with double digit returns +26.09% and +27.78% consumer discretionary climbed +3.8% last week. Consumer staples, financials and utilities also rose.
In communication services, shares of Paramount Global (PARA) climbed 14% on the week his week. Bloomberg reported the company is in exclusive negotiations to sell its Black Entertainment Television network for $1.6 billion to $1.7 billion, according to people familiar with the matter.
Apple (AAPL) shares led the rally in the technology sector, climbing 7.5% following an Oppenheimer report from late last week that said the consumer technology company's move to incorporate artificial intelligence in the iPhone, iPad and Mac, is likely to add fuel to anticipated revenue and earnings growth.
In consumer discretionary, Tesla (TSLA) shares jumped 27% this week after stronger-than-expected second-quarter deliveries, which Wedbush Securities said indicated the worst is over for the electric vehicle maker.
The energy sector fell -1.3%, followed by a -1% drop-in health care and a -0.6% decline in industrials. Materials and real estate also eased. Decliners in the energy sector included APA (APA), which fell -2.9% this week as analysts at Goldman Sachs and UBS trimmed their price targets on the stock.
Economic data expected next week include the consumer price index and producer price index for June. Both inflation readings are likely to be closely watched as investors try to predict the Fed's next moves.
One of the more intriguing facts of the 2nd quarter was the weighting of the S&P 500 in looking at the sectors the communication and technology sectors increased their weight in the S&P 500 by more than +25%. While Healthcare, Utilities, Real Estate and Energy all drop by more than 20%. This is an indicator that the markets are too focused on a handful of companies. The breath of the markets is narrow, and this could be a warning sign.
Risk
When you read or speak with most advisors, they are going to give you as rosy a picture on the markets and the economy as possible. They need to because their objective is to acquire as much of your investable assets as they can. We believe its our responsibility to share relevant information with you so that you can make decisions on your portfolio that best suites your ability to tolerate risk and more importantly your capacity to handle a downturn. So, while we have been most cautious, we find that this environment is a bit tricky since no economy has ever deployed trillions of dollars over a short period of time. So, the results of such an action may take a while before the long-term effects are experienced. In the meantime, take all information digest it and make the best decision you can
Claudia Sahm worked as an economist at the Federal Reserve. During her time there she developed a theory some often refer to it as the Sahm Rule. It has often been referred to an excellent indicator to recessions. Basically, the rule states that a recession is likely on a 0.5% rise in the 3-month average of the unemployment rate. The last three unemployment rates were 3.9% in April, 4.0% in May, and 4.1% in June, which was released last Friday. The low point in the 3-month average was 3.5%, first hit in January 2023. Going out two decimals falls just short of triggering the rule at a 0.43% increase in unemployment. Some economists believe it is a lock the recession indicator flips on when the July employment report is released on August 2 because April’s 3.9% reading falls out of the calculation.
The indicator is not a perfect timing instrument: the Sahm Indicator was at .43% in February 2008, after the recession had already started. Back then, many consumers did not realize we were in one, and certainly very few market strategists. However, shortly afterwards, the wheels started to fall off the economy. So, the question today is whether the Fed is risking a recession by not cutting rates now. But cutting them too soon may reignite inflation. This discussion will probably intensify on August 2, after the July 30-31 FOMC meeting, where no one expects a rate cut.
All economic downturns have one common element. They are all the result of bad decisions. While there has been some positive progress in the inflation fight, we might have a long way to go in getting the last few inches. This week’s CPI reading for June will give us a better picture. CPI for May was unchanged, compared to the 0.3% rise in April. The media was quick to announce that it marked the lowest reading since May of 2020. Core CPI, which excludes food and energy, rose +0.2%, down from the April pace of 0.3%. On a 12-month basis, the CPI and core CPI advanced 3.3% and 3.4%, respectively, again showing a modest slowdown in consumer price growth. The Fed’s target inflation number is 2% and +3.4% is significantly off target.
The Producer Price Index (PPI) also showed a slowdown in prices at the wholesale level. So, Treasury yields fell sharply, (prices rose) on the benign inflation data. This gave the bond buyers confidence that they could sell higher coupon bonds for more money when the Fed begins cutting interest rates. Seems a bit speculative
In addition, the economy also added an estimated 206K jobs in June and 27K jobs in May, which was more than 100,000 above the revised prior-month figure and far exceeded the forecast of 190,000. The Labor Department report also showed a modest uptick in the unemployment rate, from 4.0% in May to 4.1% last month. So, think about this? Jobs increase significantly and unemployment also increases. Our interpretation is that many of those jobs are part time and if a person acquires two part time jobs it is counted twice.
While inflation has receded significantly from its 9% high in June 2022 to its current 3.27%. Contrary to what the media was telling us, inflation was transitory, because it was a result of supply chain disruptions that were caused by COVID. By definition, it was transitory because it was destined to get resolved as shipping containers would eventually get unloaded and supplies would have been replenished. Inflation would have declined without any of the Federal Reserve actions. This form of inflation is referred to as “demand-pull.” It is caused by demand for goods and services exceeding supply. Demand was a result of the trillions of dollars put into consumer pockets by the government for such a long period of time. Again, this tends to be transitory in nature. Transitory inflation is NOT defined by time but rather the cause, which was temporary. But thanks to the media sensationalizing information and misleading listeners and the politicians demanding immediate actions we created another problem.
The more classical form of inflation is known as “cost-push,” which is not transitory. It is caused by too many dollars chasing too few goods. This happens when a government prints too much money, as has been happening globally over the past decade. Argentina and Venezuela are two examples of resource-rich countries that are still suffering from hyperinflation (defined as inflation above 50%) because their governments made serious monetary mistakes that the U.S. seems to be repeating.
The U.S. printed more money during the pandemic than any other country, exposing it to cost-push inflation which we expect will last a long time and will probably keep inflation above the current 3% level. Many economists think it’s the next wave that has not hit yet, with the U.S. money supply about $3.5 trillion above trend, which is the amount needed to run the economy. There is $3.5 trillion too much money. It’s going to have a negative impact.
So, what’s the risk? We have mentioned this in past articles that historically markets revert to their mean when we see large swings in one direction or the other over a short period of time. With the stock market at record highs, and many valuations stretched, (Remember that the S&P 500 is up 35% since Oct 27 of 2023) it might be wise to evaluate your positions and review risks exposure. But if you take a closer look at the companies that make up the S&P 1500 a broader based index that includes mid cap stocks. More than 63% of the companies listed in the index posted a negative return in Q2 23% posted a return between 0% and 10%. Only 13% of the companies listed in the index post a return greater than 10% and many of the headlines have been on the handful of companies that have posted extraordinary returns.
The risk to you, as an investor, isn’t simply the danger of some negative event, it’s the time horizon and need to liquidate (especially if you are retired and depend on those assets) as well as the probability of a specific event and your portfolio’s exposure to it. How you are positioned says a great deal about how much attention you are giving your investments and maybe how worried you should be about any risk.
From the market’s perspective the stock market seems to be testing the central bank’s “high for longer” interest-rate course and predicting more rate cuts than the Fed has projected. June’s FOMC, decided to keep the federal funds rate in the 5.25%--5.50% range, and is now forecasting just one interest-rate cut this later this year, down from 6 in Oct of 2023 and 3 at the time of its March meeting. The next meeting is at the end of this month, and we should get more guidance. Keep in mind that rate cut projections are all contingent on inflation’s downward trajectory. However, with both the May CPI and PPI coming in flat, the Street is still betting on an interest-rate cut, now the market is projecting it will be as early as the September FOMC meeting. This month’s reading for June will determine the market’s confidence of those cuts. Data dependency seems to be too trendy a topic and one economic data point does not make a trend. We are close to the midpoint of summer with kids out of school families taking vacations and spending more money than they typically do during the winter months, while this is a good thing it may also contribute to June’s inflation numbers.
For rates cuts to happen in September the Fed would really need to see some real weakness in the economy with both unemployment increasing and GDP declining.
With second-quarter earnings season under way, Wall Street’s attention will be on earnings in addition to the U.S. economy and the Federal Reserve. The question for investors remains will the central bank reverse the course of its monetary policy. In this environment, if your investments are made up mostly of ETF’s you really need to know the underlying assets in your portfolio which should consist mostly of high-quality stocks, perhaps moving a little to cash Money Market Mutual Fund) might be a good idea as well since you can still get a decent yield on that.
Technical Perspective
The first half of 2024 is now behind us. It’s also hard to believe that the events of this year have just begun. With a contentious and widely discussed election happening in just a few months, let’s have a look at where markets stand today.
The first half of 2024 was the best first six months of an election year since the S&P 500’s 1950 inception. Keep in mind that there are only nineteen data points, but it is interesting, nonetheless. Given all the negative news out there, one would probably expect that the markets would be doing much worse.
But are the markets really doing all that well?
Most major market indexes are up in 2024, but not by much. The S&P 500’s strong first-half performance has been led by large technology stocks. While the market index is up around 14%, the equally weighted S&P 500 is up less than 5%. It’s like leading a basketball game where one player has most of the points. If that player gets hurt, does the team have enough strength to keep winning? The good news is that the player is still on the floor and doing well. There is something to be said for momentum.
In the second quarter of 2024, the Information Technology sector was up more than 8.50%. That sector represents 32% of the S&P 500. The Communications sector was up about 4% (9.3% of the S&P 500). More than half of the S&P 500 sectors were actually down for the quarter. While the S&P 500 was up +4% in Q2, the average stock was down about -2.5%.
So, what is this telling us?
That the markets are driven by a handful of companies and that the media is only focused on the sizzle for the moment.
If we look at the chart below, we can see that 63.7% of the companies in the S&P 1500 experienced a negative return in Q2 only 4.5% experienced a return of 20% or more
YTD 50% of the companies in this index are negative on the year

Low volatility is a sign of a bull market, but volatility can also become too low. When you have decreasing volatility over an extended period, it can be like the compressing of a spring. Eventually, pent-up pressure needs to be relieved and when it happens, we’ll experience a bit of pain.
Markets tend to relieve pressure in the form of outlier days, an outlier day is defined as any trading day that is beyond +/-1.50%. This is calculated by taking the daily standard deviation of S&P 500 trading days during a bull market, and then using bell curve math. Statistically, an outlier day should occur once every 20 days on average during a normal (rational) market year, which is about 10-20 outlier days per year for the S&P 500. That means that through the first six months of this year, markets should have experienced roughly seven outlier days. However, markets only saw three. The last outlier day occurred back in April.
As a result, volatility has entered “extreme low” territory. While declining volatility is a positive characteristic for markets, extreme low territory heightens the probability of seeing an outlier day, in either direction. Most of the time, markets return to normal, rational fluctuations after an outlier or two have occurred in a bull market.
So, if this concerns you, be on the lookout for an outlier day in the near future.
While technology-related stocks have been dominant, be aware that there are risks involved in these areas. Many of these stocks are “extended,” meaning they have come too far, too fast. While most have not begun to correct, it is a possibility. The market’s best performer and currently the second-largest stock, Nvidia, has seen some volatility in the last two weeks. From June 18th through the 25th, NVDA stock had a stretch of trading days that went: +3.5%, -3.5%, -3.2%, -6.7%, +6.8%. That feels a lot more like speculation than it does rational trading.
In addition, we are currently keeping a close eye on residential real estate stocks. REITs and Commercial Real Estate has been one of the worst performing S&P 500 sectors in the last few years. We understand that work from home and office occupancy has been a contributor to that. But some residential real estate stocks are attempting to turn the corner. We will continue to monitor these stocks for opportunities. Still as interest rates continue to stay at the current level the markets have been wrong about the number of rate cuts and keep ignoring the signals. At some point a number of companies will face the reality of living in a world of higher rates.
The Week Ahead
Several scheduled geopolitical events and economic reports this week could influence market sentiment. Sunday will see reports from French parliamentary elections as global markets weigh those outcomes against the recent Labour party victory in the UK.
US consumer credit reports are due later Monday, providing insight about consumer borrowing, but the big events start Tuesday when Fed Chair Powell testifies before the Senate Banking Committee. Investors will be listening for further evidence of a possible dovish pivot. The realities of any future rate cuts will be contingent on inflationary data with major indicators arriving with U.S. CPI reporting Thursday and U.S. PPI Friday. The world’s second and fourth largest economies release pricing data Tuesday with China reporting CPI and PPI and Japan reporting PPI. Second quarter earnings season begins in earnest late in the week as DAL and PEP are scheduled Thursday, followed by banking giants JPM, WFC and C all reporting premarket open Friday. Many analysts are expecting robust YoY earnings growth rates for S&P 500 stocks this quarter with some expecting rates not seen since Q1 2022
This article is provided by Gene Witt of FourStar Wealth Advisors, LLC (“FourStar” or the “Firm”) for general informational purposes only. This information is not considered to be an offer to buy or sell any securities or investments. Investing involves the risk of loss and investors should be prepared to bear potential losses. Investments should only be made after thorough review with your investment advisor, considering all factors including personal goals, needs and risk tolerance. FourStar is a SEC registered investment adviser that maintains a principal place of business in the State of Illinois. The Firm may only transact business in those states in which it is notice filed or qualifies for a corresponding exemption from such requirements. For information about FourStar’s registration status and business operations, please consult the Firm’s Form ADV disclosure documents, the most recent versions of which are available on the SEC’s Investment Adviser Public Disclosure website at www.adviserinfo.sec.gov/
The Optimized Investor


CONTACT
320 W Ohio Street
Suite 328
Chicago IL 60654
312.263.1590 X 101
Gene@optfinancialstrategies.com
General Advertising Disclaimer: This website is provided by Optimized Financial Strategies which is part of Optimized Capital, LLC (the “Firm”) for general informational purposes only. This information is not considered to be an offer to buy or sell any securities or investments. Investing involves a potential risk of loss and investors should be prepared to bear losses. Investments should only be made after a thorough review with your investment advisor, considering all factors including personal goals, needs, risk tolerance and most important capacity for risk. Optimized Capital is registered investment adviser that maintains a principal place of business in the State of Illinois. The Firm may only transact business in those states in which it is notice filed or qualifies for a corresponding exemption from such requirements.