Market Strength
Is it Different this Time? Sort of
Market Review for the week of
May 20th 2024
The content of this Newsletter is to provide you with Economic insights to assist you in making better decisions with your investments. Unlike many other financial periodicals we will not mention specific companies, unless it is relevant to an overall economic issue. We welcome your questions on economic concerns and will address in our newsletter. just email us at info@optfinancialstrategies.com #FinancialAdvisor,#investmentmanagement #wealthmanagement #financialplanning #retirementplanning #401kplans
Market Recap
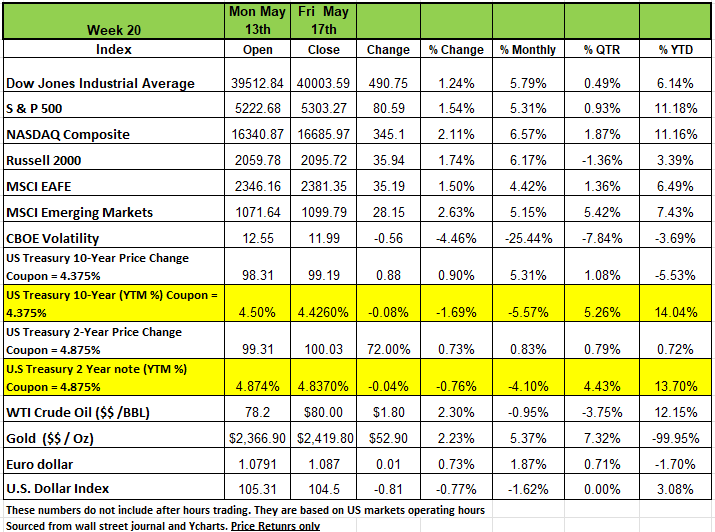
The DOW broke the 40,000-mark last week closing at 40,003.59 bringing its YTD price return to 6.14% The largest return on the week was in the NASDAQ with 2.11% return and YTD 11.16% The S& P 500 index rose 1.5%, marking the fourth straight weekly gain, as investors were encouraged by signs of easing consumer price inflation from Wednesday’s CPI report.
Data released last week showed the US seasonally adjusted consumer price index, a measure of inflation, rose by 0.3% in April, below expectations for a 0.4% increase and following a 0.4% gain in March. Core CPI, which excludes food and energy prices, also rose by 0.3%, right on the consensus estimate and following a 0.4% gain in March.
Keep in mind that the US producer price index increased 0.5% in April on a seasonally adjusted basis, which was more than the 0.3% rise expected and compared with a downwardly revised 0.1% decline in March. Equities still rose with Federal Reserve Chair Jerome Powell saying that the US economy is performing "very well" with a strong labor market and rising employment and wages, though with some signs of "gradual" cooling. Powell made it clear that regardless of the noise rates would stay higher for longer, markets tend to disagree.
Treasury yields dropped moderately over the course of the week on the optimistic inflation report and other economic data. On Tuesday, despite the higher-than-expected April Personal Price Index report, the Personal Consumption Index, which is the Federal Reserve Bank’s preferred inflation metric, dropped to its lowest level in 3 years. On Wednesday, the Consumer Price Index showed an increase of 0.3% month-over-month and 3.4% year-over-year, compared to consensus expectations of 0.4% and 3.4%, respectively, and both were 0.1% lower than the previous month. This led Treasury yields to drop significantly from the beginning of the week through Wednesday as investors shifted back from speculating if there would be a rate cut by the Fed this year, to when there would be a rate cut. Treasury yields did climb back up moderately on Thursday and Friday as comments from Fed officials tempered the optimism for rate cuts. Three regional Fed Presidents argued that it may take longer than desired for inflation to fall to the Fed’s 2% target.
The market implied probability of an interest rate cut by the September 18th meeting increased from 76% at the beginning of the week to 83% by the end of the week. However, the market implied Federal Funds Rate at the end of 2024 only dropped slightly over the course of the week from 4.915 to 4.890. Last weeks Treasury auction saw the coupon on the 10 year increase from 4% to 4.375%.
Sectors
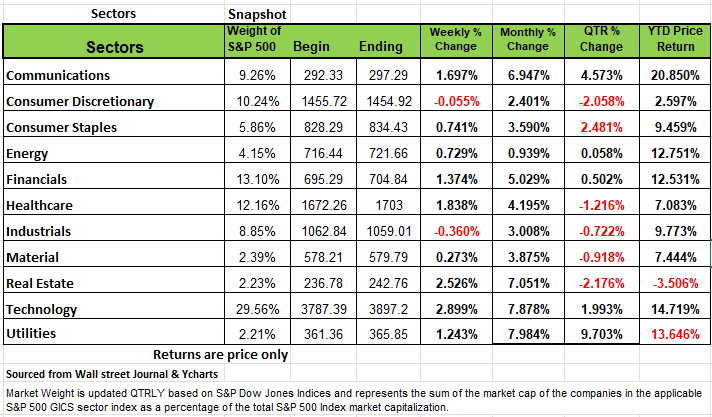
All but two of the S&P 500 index's 11 sectors rose last week. The advances were led by technology, which climbed +2.9%, and real estate, which rose +2.5%. Other sectors up by more than 1% included health care, +1.83% communication services, +1.69% financials, +1.37% and utilities continued its rise +1.24%.
The technology sector's gainers included shares of Palo Alto Networks (PANW), which rose 6.9% as the company agreed to acquire International Business Machines' (IBM) QRadar software-as-a-service assets as part of a broader partnership. Also, BofA Securities said Palo Alto Networks is likely to report "solid" fiscal Q3 results due to growth in Next Generation Security, offsetting likely weak firewall trends.
The two declining sectors were industrials, down -0.4%, and consumer discretionary, easing -0.1%. Perhaps consumers are shifting the spending to more needs-based items than wants.
The industrial sector's decliners included shares of Deere (DE), which shed -2.7%. The company cut its full-year profit outlook as lower shipment volumes dragged down the agriculture and construction equipment manufacturer's fiscal Q2 results.
This week, April existing home sales are due on Wednesday, followed by April new home sales on Thursday. Other data will include April durable goods orders and May consumer sentiment on Friday.
Is This Time Different? Sort of
It seems that academics are finding themselves in a unique situation. They have reached a point where historical patterns and behavior for predicting outcomes have changed. The old patterns that economists have studied and used to forecast economic cycles, no longer seem to apply. At least for now. One such example of this is the spread between the 2s/10s Treasury yield curve. It has now been inverted for 22 months, exceeding the old record of 20 months set in the Volcker era back in the early 1980’s. Historically, the average time span between curve inversion and a recession has been 16 months. The Leading Economic Index has been on a declining trend for two years and conventional wisdom had been that a recession would occur once we had four consecutive down months. It’s now been 26 months since the Federal Reserve started its hiking cycle and historically a recession should have started by now.
Academics rely heavily on analyzing patterns and outcomes from historical data to forecast Economic outcomes. That faith in those models provides the rationale for John Templeton’s famous quote, “The four most dangerous words in investing are ‘this time it’s different.’” It also suggests a warning against recency bias that assumes the current situation not only differs from the past but that it will also persist into the future. But we also need to note that the world is different now, never has the US government ever injected trillions of dollars into the economy over such a short period of time. We have no historical data on its impact. In addition, the emergence of computers trading positions in Milla seconds is relatively new. Lastly, we have billions of dollars flowing into the market every two weeks just from deposits in 401K plans.
Last year, as inflation raged and rates climbed, market consensus held that zombie companies would go begging for credit, recession loomed, the Fed would ride to the rescue. Here we are a year later, and we seem to be in the exact same place. We have seen neither a full-blown recession nor a credit purge beyond the margin. We continue to watch a bifurcated economy with lower income consumers and smaller companies struggling, and higher income households and larger companies are doing just fine. The expected rate cuts keep getting pushed back and while this rally which began on Oct 27th with Powells press conference predicting several rate cuts in 2024 seem unlikely. And the markets do not seem to care.
So, is it different this time? Sort of.
Two critical developments have been making new and underappreciated contributions to the current situation. As mentioned earlier, we are still deeply rooted in a post-COVID global economy contending with staggering amounts of stimulus: $12 trillion was added to global central bank balance sheets between 2020 and 2022, and even with quantitative tightening, only $5 trillion has been taken out.
In the United States, M2 money supply growth—the flow—may have turned negative since jumping 41 percent from February 2020 to March 2022, but the stock of money supply is still near all-time highs.
The seismic impact of monetary and fiscal stimulus was like a giant meteor crashing into the Pacific Ocean. The stimulus created initial waves of liquidity that were deep enough to overcome the complete shutdown of the global economy during the pandemic. Subsequent waves helped pull the economy out of the depths of a recession, but in the United States the waves are still coming and there is still unspent stimulus in the system. So, while we think the Fed is fighting inflation, it is also fighting the echo effects of the trillions of dollars in stimulus. As evidence to this theory is that other developed economies, which did not have as much stimulus, have slowed down considerably while U.S. growth continues its pace. This is unprecedented. So, yes, it is different this time.
The second issue is another other abnormal factor in this current cycle. It is the surge in immigration, mostly illegal, which has helped keep the labor market humming, but has also skewed the economic data and made it less reliable. Recently updated demographic estimates from the Congressional Budget Office show a sharply higher estimate of net immigration, which is entirely due to illegal immigration. This immigration likely helped to meet excess labor demand in 2023, which created a positive supply shock that helped the economy expand even as inflation came down.
One possible explanation for this dynamic is that immigrants have higher labor force participation rates, boosting supply more than demand, at least in the short term. The demand for rental housing by the influx of immigrants has also been distorting rental rates, which are the largest contributor to CPI inflation data approximately 30% of the weight of the calculation.
Immigration may also explain the recent disparity between gross domestic product (GDP) and gross domestic income (GDI) the income generated from producing GDP. A potential reason for this discrepancy is that many immigrants have come to the United States to work, but they do not earn income in the traditional sense because many are employed off the books, paid cash, so it is not trackable. Immigrants are also being subsidized in many cases, so while they may not initially derive officially recorded income from work, they are also getting spending money directly received from state, city, and federal dollars. This combination of difficult to track income and easier to record spending likely contributed to this divergence between GDI and GDP. Real GDP is trending stronger than it otherwise would be relative to real GDI, suggesting that undocumented workers’ consumption is supporting GDP, but the income they are receiving to support that spending is not picked up in GDI.
We think that we would have seen a recession by now if the economy would not been affected by the stimulus and surge in immigration. The current expansion business cycle has not ended yet, it has been extended by the impact of extraordinary monetary and fiscal stimulus and increased immigration. While it may seem as if our economy is no longer sensitive to higher interest rates, the impact of higher rates has simply been delayed because both corporate and consumer balance sheets have been well-insulated from a decade long period of ultra-low rates and high liquidity.
These are the factors that we believe have delayed the downturn, which should occur soon, just not sure exactly when it will arrive.
One reason we believe that a downturn is on its way is that we are starting to see change in a few areas. Default rates for instance are staying stubbornly high. Credit card delinquency rates for lower income consumers are rising quickly. Stress in commercial real estate continues to persist, specifically in the office sector, with so many people working from home. These are obviously not the jobs fill by immigrants. More households and companies will succumb to the stress of higher interest rates as they stay higher for longer. There will also be more stress on the regional banks as these loans go into foreclosure. With warmer weather now upon us the fate of the economy will rest on the consumer and how much of their wants impact prices. While April’s CPI number was favorable, one data point does not solidify a victory. If the consumer, especially younger consumers continue spending we could possible see inflation reignite. The latest Fed Beige Book suggests only limited signs of reheating. Perhaps most importantly, the echoes of COVID should start to subside as the ratio of total M2 to GDP, while still high, falls closer to the historical trend line.
If May’s CPI number comes in above consensus the Higher-for-longer policy will most likely fuel more market volatility in the second half of the year. Investors would be wise to remember that fixed income generally does well when the Fed is on pause. An extended or delayed economic cycle is not a bad environment for credit, but it makes sense to be somewhat defensive when adding to credit positions.
Investors should favor issuers that are at less risk of being unable to service their credit obligations. In addition, as the interest sensitive parts of this bifurcated economy increasingly struggle to access credit, less liquid sectors could present opportunities to earn yield at the margin. As banks continue to exit lending to real estate, commercial mortgage loans could emerge as attractive value alternatives if discounted enough.
Spreads are likely to remain tight, but nominal yields remain attractive and offer reasonable entry points, including in higher quality high yield.
Active investors should take advantage of the markets as they evolve and not remain fixed on what should be occurring based on historical precedent.
Remember that your advisor’s job isn’t to predict the economy, it is to manage your portfolio within dynamic markets. Especially based on your liquidity needs. While it seems to be different this time, and in a way, it is a little, recessionary pressures are still out there. It’s wise to be grateful if you have profits to take, as Warren Buffet is often quoted be fearful when others are greedy and greedy with everyone is fearful. Keep your eyes open and pay attention to the environment, the second half of the year could be very different from the first half, which calls for careful positioning now. Source By Anne Walsh, Chief Investment Officer, Guggenheim Partners
A Technical Perspective
There’s an old saying that bull markets “crawl a wall of worry” and bear markets “slide a slippery slope of hope.”
Think of all the headlines we have seen in the last two years. Inflation is at its highest level since 1981; the national debt is closing in on 35 trillion dollars; mortgage loan rates are at their highest levels since 2000 while the median home price is up +30% in the last four years; wars are breaking out and escalating in the middle east; and socialism is becoming increasingly popular among young Americans.
Even with those challenges, markets, and more specifically large cap stocks, have not experienced an extended and deep bear market since the Financial Crisis. In fact, any large decline has been met with a quick rebound to a new high. Now, eventually a bear market will happen and will be driven by some unknown future event, but right now this market continues to climb and crawl a wall of worry.
A Shift in Leadership
At least there is one worry that is starting to ease in the markets, and it has to do with sector leadership. We have mentioned several times that 2023’s market rise was fueled and led by the strength of technology-related stocks. The “Magnificent 7” dominated last year, and due to their overly large weight within the S&P 500, pulled the market index higher. The Magnificent 7 companies were out in front leading the climb, while most of the rest of the companies in the index never left the bunkers.
Now, there has been a significant shift in market leadership.
According to our risk adjusted strength rankings, which account for a both a sector’s momentum as well as its volatility, information technology (the largest S&P 500 sector at 29% of the index’s capitalization) now ranks 8th out of the 11 US sectors. Communications (containing Meta and Google) now ranks 9th, while Discretionary (Amazon and Tesla) now ranks dead last out of the 11 US sectors.
So, which sectors are at the top of the risk adjusted rankings? While Financials ranks 1, the remaining leadership belongs to the conventional “defensive” sectors. Utilities is 2 while Consumer Staples, Industrials, and Health Care round out the top five. At the beginning of this year, Utilities was ranked last, and Staples was near the bottom of the sector rankings.
Markets are weaker and less sustainable if indexes are being led higher by a handful of companies. A rising tide should lift most ships, and right now sector strength is more evenly dispersed.
The table below shows the three months change in sector rankings, according to risk adjusted strength ranking (which is technically referred to as “volatility-weighted-relative-strength”).
Another item to keep in mind is that the risk of these sectors are considered more defensive plays, usually these sectors perform better when the economy begins to shift.

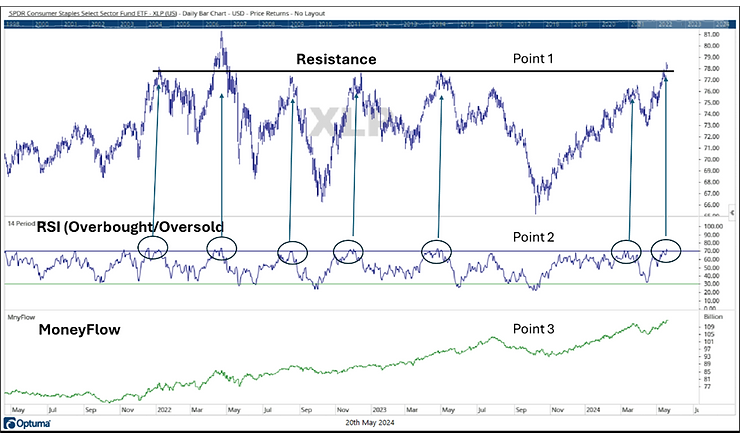
This week's focus is on Consumer Staples. This sector includes like Procter and Gamble, Coca-Cola, Wal-Mart, and Costco. We should note that Consumer Staples has a much different looking chart than Utilities did before we highlighted it a few weeks ago. .
Above is the chart of Consumer Staples, using the State Street Select Sector SPDR ETF, XLP
1. You can see that XLP has trended sideways for the last few years. Each of its relative peaks occurs around the same $77-78 price range, before supply takes over and causes a selloff. The ETF is now at that same point again. Will it be able to sustain a breakout of overhead resistance? Will that resistance then become support?
2. Point 2 is the RSI, which measures overbought and oversold conditions. When a Security is overbought, it has gone too far, too fast. Each time XLP has hit the resistance line, it has also been overbought. Overbought conditions typically precede a pullback.
3. Point 3 shows that Money Flow is at a new high. Money Flow is a volume indicator and should confirm positive price moves. During the ETF’s most recent decline in October, the Money Flow index’s decline was limited. Money Flow is confirming the most recent upward movement.
The Consumer Staples sector is at a new relative peak, matching its previous point of contention while being overbought. Will this be the time that it finally breaks through resistance? It should be noted that several stocks within this sector are performing well.
The market’s sector’s leadership has almost completely rotated from what it was a few months ago. Technology stocks continue to slip in risk-adjusted ranks, while “defensive” oriented sectors rise to the top of the ranks. This could be a sign of the direction the market thinks the economy is heading. A sector like Utilities, which had been ranked last, is now ranked second. Consumer Staples has also made a run, although that sector could be meeting some overhead resistance.
With all the negative events we see on the news, remember that bull markets often crawl a wall of worry. Bear markets will happen, but the news is not a leading indicator. To put it simply, we will see volatility start to increase a little bit, before it increases a lot. News creates market noise. Source Brandon Bischoff Canterbury Investments
The Week Ahead
This week’s focus lands squarely on the U.S. inflation updates. As some signs of a gradually cooling
economy have emerged in recent employment and PMI data, the Fed will want to see a similar response in consumer prices. The timing of this month’s inflation reports is different, as PPI will arrive Tuesday, a day before CPI, and thus may provide an advance glimpse into how prices trended in April. After three straight months of above-forecast readings, April CPI is expected to come in at +0.4% MoM, same as the prior two months and still above the long-term average of +0.29%. Elsewhere, Fed Chair Powell is scheduled to speak in Amsterdam on Tuesday, while other FOMC committee member appearances are sprinkled throughout the week. Other U.S. releases of note include retail sales, the Empire State and Philly Fed manufacturing surveys, industrial production, and housing numbers.
Retail giants Home Depot and Walmart will report earnings this Tuesday and Thursday, respectively.
The international calendar is highlighted by China’s industrial production and retail sales release Thursday evening. Japan’s first estimate of Q1 GDP on Wednesday night may create additional volatility for the struggling yen, especially if the economy slips back into contraction. In the UK, attention turns to the monthly employment and wage figures, with any weakness increasing odds for rate cuts. Last of all, Europe will provide updated CPI and GDP readings, economic sentiment surveys, and the ECB’s Financial Stability Review
This article is provided by Gene Witt of FourStar Wealth Advisors, LLC (“FourStar” or the “Firm”) for general informational purposes only. This information is not considered to be an offer to buy or sell any securities or investments. Investing involves the risk of loss and investors should be prepared to bear potential losses. Investments should only be made after thorough review with your investment advisor, considering all factors including personal goals, needs and risk tolerance. FourStar is a SEC registered investment adviser that maintains a principal place of business in the State of Illinois. The Firm may only transact business in those states in which it is notice filed or qualifies for a corresponding exemption from such requirements. For information about FourStar’s registration status and business operations, please consult the Firm’s Form ADV disclosure documents, the most recent versions of which are available on the SEC’s Investment Adviser Public Disclosure website at www.adviserinfo.sec.gov/


