

The U.S. A Culture of Debt
& Market Recap
for the week of June 3rd 2024
The content of this Newsletter is to provide you with Economic insights to assist you in making better decisions with your investments. Unlike many other financial periodicals we will not mention specific companies, unless it is relevant to an overall economic issue. We welcome your questions on economic concerns and will address in our newsletter. just email us at info@optfinancialstrategies.com #FinancialAdvisor,#investmentmanagement #wealthmanagement #financialplanning #retirementplanning #401kplans
Weekly Recap
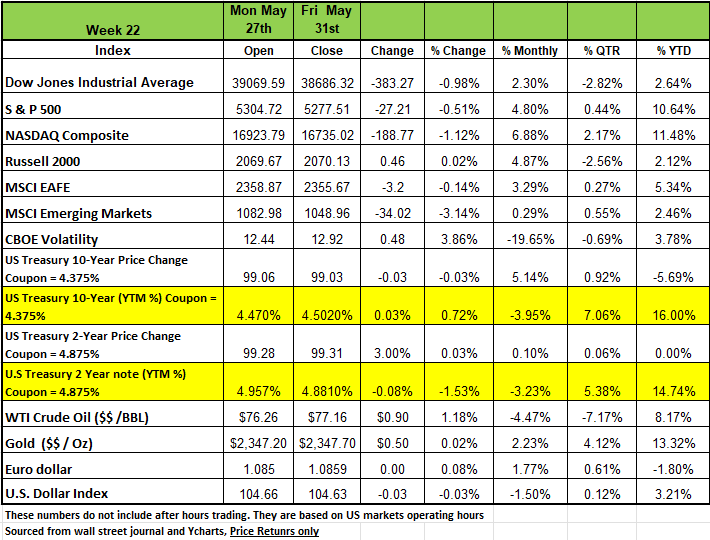
All indices posted a negative return in the last week of May, even though both the DOW and S&P performed extraordinarily well on Friday. The DOW ended the week with just under a negative 1 percent return. The S&P 500 -0.51% the NASDAQ had the largest drop with -1.12% and the Russell 2000 was the only index with a positive return with a +0.02% increase. All four of the indices posted healthy numbers for the month of May coming of a negative performing month in April. YTD all four of the major indices are in positive territory.
Last week’s Memorial Day holiday, markets were only open for 4 days of trading and had a bit of volatility. The mega-cap tech leaders of the index showed weakness during the week as five of the Magnificent 7 stocks traded lower. Could this be a sign that prices are stretched? Big box retailer Best Buy reported better than expected profitability even as sales disappointed the street last week. The company led the S&P 500 with an 18% return after management detailed the company’s service and membership revenues have boosted profit margins. Retailers Kohl’s and Gap had divergent paths last week as Kohl’s dropped -23% on Thursday and Gap popped 29% on Friday. The company's respective CEOs have been driving the polarizing performances
Treasury Yields finished with mixed results, fluctuating throughout the week with lower duration finishing lower and longer duration finishing higher for the week. On Wednesday, MBA Mortgage applications fell by -5.7% for the week, as mortgage rates increased for the first time in a month. The contract rate on a 30-year fixed mortgage increased by 4 basis points to 7.05%, denting demand for home-buying and refinancing.
On Thursday, real GDP growth in Q1 was revised lower to a consensus expected 1.3% annual rate from a prior estimate of 1.6%. Downward revisions to personal consumption and inventories more than offset upward revisions to business investment, home building, and government purchases.
Personal consumption, business fixed investment, and home building, combined, rose at a +2.8% annual rate in Q1. Both jobless claims and continuing claims ticked up for the week ending May 25th, increasing by 3k to 219k and 4k to 1.791 million, respectively. Although these levels remain low, hiring intentions from the regional Fed surveys remain negative, which could indicate an increase in the unemployment rate ahead.
Personal Income was in line with consensus expected of 0.3% on Friday for the month of April. Personal spending increased 0.2% in April but when adjusting for inflation, personal consumption unexpectedly declined 0.1%. This caused yields to fall on Friday, as the reports offered the Fed some solace about the pathway for controlling inflation
Sectors
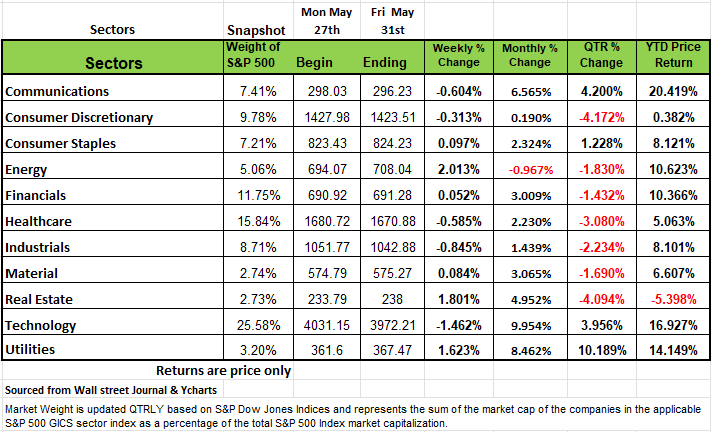
Five of the 11 sectors in the S&P 500 fell on a weekly basis, led by a -1.5% drop in technology and a -0.8% decline in industrials. Other decliners included communication services, health care and consumer discretionary.
In the technology sector, shares of Salesforce (CRM), tumbled -14% on the week. The company's fiscal Q1 adjusted earnings per share topped expectations but revenue fell short of Wall Street estimates. Also, Salesforce forecast the current quarter's results below analysts' mean estimates at the time the guidance was released.
The industrial sector's decliners included shares of American Airlines Group (AAL), which shed 17% as the airline operator cut its guidance for Q2 adjusted earnings.
On the upside, the energy sector rose 2%, real estate added 1.8% and utilities climbed 1.6%. Consumer staples, materials and financials also eked out small gains.
The energy sector's gainers included shares of Marathon Oil (MRO) amid an agreement for the company to be acquired by ConocoPhillips (COP) in an all-stock deal with an enterprise value of $22.5 billion, inclusive of $5.4 billion of net debt. Shares of Marathon Oil jumped 13% in the week while shares of ConocoPhillips edged down 0.7%.
This week, the market will kick off June with readings on May manufacturing and auto sales, but investors will be most focused on the May employment data expected later in the week
The U.S. A Culture of Debt
If you had parents that grew up during the great depression, chances are they were careful with their money. Waste was not allowed in our home or in the homes of many of my friends, even though we were financially healthy. If you wanted something, we were all raised to save for it. Debt was something that you had for large purchases such as a house. But just two generations later Americans have shifted to become a society of immediate gratification, perhaps this shift started when families began having two working parents and household incomes increased significantly, and it was just easier to give a child that they wanted than to deal with the headache od saying no.
In addition, with the evolution of technology we have become more impatient, perhaps you have noticed a friend responding to a text immediately. The combination of these two factors has resulted in short-term gratification at the probable expense of a long-term consequence. You Only Live Once (YOLO) so you better enjoy it while you can, seems to be the current philosophy for many Americans, especially younger adults.
As of Q1 2024 credit card debt alone for has risen to $1.1 trillion dollars, according to the New York Fed. This translates to approximately $8000 for the average American household, with an average credit card interest rate above 24.71%. This for a median gross income per household of $74,500. Once you account for taxes and necessary expenses such as rent/ mortgages, insurance food etc. It does not leave a lot left to pay down.
There is a lot of data about every aspect of the economy, and it is not always interpreted the same by “professionals”. First many so-called pundits usually have agenda’s especially if they are trying to attract people to invest their money with them. Second economic information is digested differently because the data has a different value to different people based on their time horizon. For example, a trader will typically look to see how that information will move markets in a given day or week. For a politician, the relevance lies in how the information will shape public opinion by the next election, let’s face it that is all that they really care about. For investors, that can vary based on their liquidity needs, but for the long-term investor & company what really matters is how the information will impact the economic and financial environment over a long period of time, often a decade or more. It is from this viewpoint that we all need to recognize the significance of the deterioration of the financial condition of the Federal government. It just has too much Debt
If you care about the size of the US debt, which is currently at $34.5 trillion dollars or approximately $103K per individual American, the country’s annual GDP is $27.3 trillion, so as a percentage, our debt is 127% of GDP. The Fed’s balance sheet has expanded from $870 billion in 2008 to $7.2 trillion today, a staggering 733% increase, and has averaged 33% of GDP over the past four years, bigger than at any time in history. It’s the 1000 lb. gorilla in the room.
Politics aside, you must be aware that whoever is elected to office this fall will have to face the issue of reducing the debt burden. It cannot be ignored, especially at the current interest rate. Last year the government spent close to $700 billion on interest payment alone and this number will continue to rise as new debt is issued at higher interest rates. Contrary to what the media may be stating we are not going back to rates below 1%. This has become a long-term consequence of zero interest monetary policy and MMT (Modern Monetary Theory) According to MMT, governments do not need to worry about accumulating debt since they can pay interest by printing money. Does this sound familiar. It’s not working.
The Tax cuts that were enacted during the Trump administration will expire next year 2025. While many of the Democrats think that we need to place the burden on the wealthy we cannot mathematically expect 5% of the population be responsible for the entire debt load. The math just does not work. This responsibility lies on the shoulders of all Americans and the wrong solution will have a consequence on the health of the US economy for generations to come.
Basically, the national debt is the amount of money the federal government has borrowed to cover the outstanding balance of expenses incurred over time. In any given fiscal year when expenses exceed revenue (ex. money from federal income tax), a budget deficit results. To pay for this deficit, the federal government borrows money by selling marketable securities such as Treasury bonds, bills, notes etc. So, the national debt is the accumulation of this borrowing along with the interest owed to the investors who purchased these securities over time. Since the federal government experiences reoccurring deficits, the national debt continues to grow and with current interest rates the debt is accelerating rapidly.
Think about the national debt like a person spending more than they earn each month and use a credit card for those purchases but because the purchases are greater than their income, they cannot pay the full balance each month, so they roll over the debt. The cost of purchases exceeding the amount paid off represents a deficit, and the accumulated deficits over time represents a person’s overall debt obligation.
Much like evaluating a person’s debt to income ratio to see if they can afford to pay off their debt or take on more debt, by evaluating a country’s debt to its GDP you can forecast the country’s ability to pay down its debt. We use a ratio to indicate fiscal health more than just the debt amount because it shows the burden of debt relative to the country’s total economic output and its ability to repay it, since there is tax revenue correlated to GDP.
The U.S. debt to GDP ratio surpassed 100% in 2013 when both debt and GDP were approximately $16.7 trillion. At the end of 2023 the total debt of the US government was $34.5 trillion, GDP was $27.36 trillion. So as of 2023 the Debt to GDP ratio was 127%.

Here is where the problem lies, when you look at the strength of the US consumer, we look at a few metrics to determine financial health.
One metric is Disposable income, this is the amount of income left after taxes and other mandatory charges are deducted from a worker’s paycheck.
Discretionary income is the amount of net income an individual can spend after all necessary expenses are paid. This would include rent/mortgage, transportation, food, utilities, insurance, and other essential costs out of their disposable income. This is the portion of an individual’s income that really drives a large part of our economy. Consumption accounts for two thirds of our GDP. A tax hike across the board will impact the disposable income and the discretionary income a person can spend. A lower level of disposable income will mean lower consumption which would result in a lower GDP. A lower GDP with a higher debt burden may result in lower tax revenue and possibly a weaker US dollar, which will mean higher cost of goods imported from overseas.
At the current pace the Federal government is running at a deficit of 6.2% of GDP or $1.62 Trillion dollars. These are annual short falls. Government spending is outpacing revenue and no one in Washington DC seems really concerned. If the law is not changed anytime soon many economists think that the financial position of the federal government will most likely worsen over the next decade.
In February, the CBO projected that the federal government would continue to run annual deficits between 5% and 6.5% of GDP over the next decade, while GDP will increase between 2-3% annually the deficit will increase at a greater pace especially with interest rates on the 10-year treasury at the current level of 4.5% on the debt. This could bring the Debt to GDP ratio to 165% by 2034.
This debt load is unsustainable and not feasible for the top 5% or 10% of the population to burden. It needs to be recognized that interest payments on the current debt, which is a result of higher interest rates, is a good piece of this current obligation, however, we do not expect rates to go back down to zero and since the government is in a continuous borrowing cycle to pay previous obligations, it is digging a whole that is going to be too deep to dig out of regardless of the interest rate.
At some point, as it has in the past, the economy will slide, and the wheels will come off. Government spending has also done the same on State and Municipal levels. While we do not think there is an immediate danger to a significant crash to the U.S. economy, the rise in the debt is should be important for long-term investors, simply because they are “long-term”, this does not just apply to the markets but also companies that risk investments to expand their business and develop areas of the country. The biggest risk associated with federal debt is not just related to excessive spending growth, insufficient tax revenues or even rising interest costs. It’s the political system and leaders that are so focused on themselves that they are incapable of addressing the issue in a mature way. To put in bluntly, we have a bunch of inept leaders in Washington. The system is broken because neither side will acknowledge a good solution if it comes from their opponents. So, no real progress can be addressed on the country’s debt without addressing the deficit. This means cutting spending in areas that are most abused Welfare and benefits associated with it, defense, which unfortunately would make the country vulnerable, social security needs to be changed, the model just does not work, and raising taxes needs to happen across the board for everyone. The question we do not have an answer to is just how painful it will be to fix the problem.
A Technical Perspective
Last Week’s Market Action
Most markets declined last week, led by shakiness in the Information Technology sector. The sector was down -2.34%, while 8 of the 11 sectors were up for the week. Information Technology is the largest sector in the S&P 500 by a considerable margin, accounting for 30% of the S&P 500’s market capitalization. The next largest sector is Financials, which represents 12%. So goes technology, so goes the market.
Friday’s market action was interesting. After being down -0.80% at one point during the trading day, the S&P 500 rallied in the last 30 minutes of trading to finish up +0.80%. All 11 S&P 500 sectors were up on the day, yet the Nasdaq 100 (technology-related index) was down. I imagine that does not occur very often, if ever. A single trading-day is nothing of note, but the fact was interesting, nonetheless.
Investor Sentiment
Sentiment is a contrarian indicator. That means investors feel more optimistic closer to peaks, and more pessimistic near market bottoms. This year has seen extraordinary amounts of “bullish” or positive sentiment among investors, according to the Investor Sentiment Survey that is published weekly by the American Association of Individual Investors.
The latest survey (published 5/29) showed that 39% of investors were bullish; 27% were bearish; and 34% were neutral. While bullish sentiment fell over the week, it remains above historical averages. Here is a quote on those numbers, from the AAII:
Bullish sentiment, expectations that stock prices will rise over the next six months, decreased 8.0 percentage points to 39.0%. Bullish sentiment is above its historical average of 37.5% for the 29th time in 30 weeks.
The bull-bear spread (bullish minus bearish sentiment) decreased 8.4 percentage points to 12.3%. The bull-bear spread is above its historical average of 6.5% for the fourth time in seven weeks.
Investor sentiment tends to fluctuate with the markets, which is why it is a contrarian indicator. When markets are strong, sentiment is high. If markets become choppy, bullish sentiment will tend to decline. Extreme optimism or extreme pessimism will tend to precede a move in the opposite direction. Right now, sentiment is not extreme in either direction.
Market Breadth
A rising tide should lift most ships. A market led by a select few, large stocks, while smaller components waver, is not a healthy market. Right now, market breadth appears to be strong.
The advance-decline line, which measures market breadth, is confirming the market’s upward moves. Most stocks are advancing along with it, and a rising tide is lifting most ships.
Chart of the Week- Communications (XLC) ETF
While T-Mobile has trended sideways over the last 4 months, it has had some positive technical developments, such as rising Money Flow and rising relative strength. The stock is now in a crouch. It’s only a matter of time before it makes a move, one way or another.
Last week, T-Mobile broke out of that trading range to the upside. T-Mobile stock is in the Communications sector, which will be our featured chart of the week in this Commentary.
Here is a chart of the Communications Services Select Sector SPDR ETF (Ticker: XLC).
This article is provided by Gene Witt of FourStar Wealth Advisors, LLC (“FourStar” or the “Firm”) for general informational purposes only. This information is not considered to be an offer to buy or sell any securities or investments. Investing involves the risk of loss and investors should be prepared to bear potential losses. Investments should only be made after thorough review with your investment advisor, considering all factors including personal goals, needs and risk tolerance. FourStar is a SEC registered investment adviser that maintains a principal place of business in the State of Illinois. The Firm may only transact business in those states in which it is notice filed or qualifies for a corresponding exemption from such requirements. For information about FourStar’s registration status and business operations, please consult the Firm’s Form ADV disclosure documents, the most recent versions of which are available on the SEC’s Investment Adviser Public Disclosure website at www.adviserinfo.sec.gov/
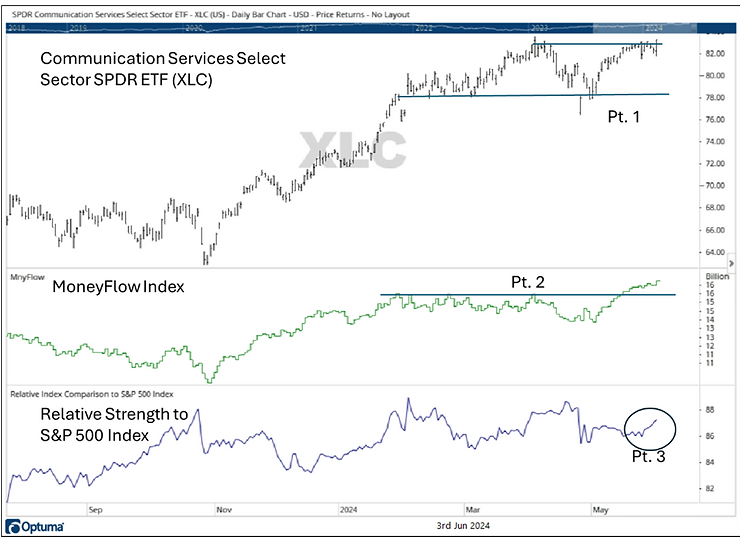
At point 1, you can see that XLC has been in a small trading range after making a high. Following the peak in late April, the ETF declined to a level of support and held. Now, XLC is matching that April high water mark and attempting to break above it.
2. Even while XLC was increasing in price to its high in April, its MoneyFlow index was moving sideways. MoneyFlow is a volume indicator that measures “smart money.” Volume should confirm price move. After its recent decline, MoneyFlow has been very strong as XLC has increased. While the ETF is at the same price level as it was in April, MoneyFlow is at a new high.
3. With market breadth being strong, it makes sense that XLC’s relative strength the S&P 500 has been relatively flat in 2024. Improving market breadth means that more than just a few sectors are participating. Recently, however, XLC’s relative strength has begun improving. This was also highlighted in our Sector Ranking comments.
The Communications Services sector is one of the better performing sectors on a risk-adjusted basis this year. It should be noted that, like many S&P sectors, the sector is top heavy. Meta (formerly Facebook) accounts for 21% of the sector’s capitalization, while Google’s two share classes make up 26%. So nearly half of the sector is in just two stocks. T-Mobile, Netflix, and AT&T are the next three largest stocks in the sector, combining for 12% of its capitalization. (Source: XLC holdings on 6/3/2024).
Even if the sector is top-heavy, investors can get exposure to its larger components with the likelihood of having lower volatility by investing in the Communications ETF. Source Brandon Bischoff Canterbutry
The Week Ahead
The U.S. jobs data and a couple of central bank interest rate decisions are the main events on this week’s economic calendar. It’s looking less and less likely that any inflation relief, which could lead to interest rate cuts, will come from a weakening U.S. labor market. Unemployment claims have remained around 220k week after week, a historically low level, and although monthly job growth has cooled, the numbers are far from recessionary. The U.S. economy is forecast to have added 185k jobs for May in Friday’s non-farm payrolls report. With no major inflation updates on the docket, investors will scrutinize other reports, such as the ISM PMI surveys, for signs of price pressures reigniting or abating. Goods inflation has started to creep into manufacturing as commodity prices have risen. There is also the average hourly earnings component of the employment report and the revised Q1 unit labor costs figures on Thursday to consider. Factory orders and consumer credit round out the U.S. calendar. On the international side, the ECB is highly likely to be the first major central bank in this cycle to lower interest rates, so President Lagarde’s statement on Thursday will be closely watched for signs of what the rest of 2024 may bring. With wage growth and services inflation proving stubborn and the economy recovering, traders now expect only two rate cuts this year, with less than a 50% chance of a third. The European Parliament, which determines legislation across the EU, will hold elections beginning Thursday. The Bank of Canada meets Wednesday, and although the interest rate markets suggest less than 50% odds of a cut, declining inflation pressures could trigger a surprise ahead of the ECB. In China, the Caixin PMI indices follow the disappointing government numbers released last week. The rest of the overseas agenda includes German factory orders and industrial production, Australian GDP, and Eurozone PPI
The Job Openings and Labor Turnover Survey (JOLTS) for April will be released on Tuesday June 4 at 10 am E.S.T. The widely followed openings rate data is ironically the least reliable data in the report. Focus on the Quits Rate, an indicator of how comfortable workers are about finding a new job. It has been dropping steadily for two years.
This article is provided by Gene Witt of FourStar Wealth Advisors, LLC (“FourStar” or the “Firm”) for general informational purposes only. This information is not considered to be an offer to buy or sell any securities or investments. Investing involves the risk of loss and investors should be prepared to bear potential losses. Investments should only be made after thorough review with your investment advisor, considering all factors including personal goals, needs and risk tolerance. FourStar is a SEC registered investment adviser that maintains a principal place of business in the State of Illinois. The Firm may only transact business in those states in which it is notice filed or qualifies for a corresponding exemption from such requirements. For information about FourStar’s registration status and business operations, please consult the Firm’s Form ADV disclosure documents, the most recent versions of which are available on the SEC’s Investment Adviser Public Disclosure website at www.adviserinfo.sec.gov/
The Optimized Investor
